CompositePodGroup work describes an alpha API.
#139596See what’s hard to spot one ticket at a time.
BTA helps engineering teams make sense of their project history, so they can find what needs attention faster. It brings related issues and pull requests together, shows what keeps coming up and what remains unresolved, and links you to the work behind it.
Get up to speed on an unfamiliar system, investigate a recurring problem, or prepare for a migration or upgrade.
Self-hostedGitHub and GitHub EnterpriseLinks to sources
US Patent 12,106,240 B2
Issues and pull requestsRelated workPatterns to examineSource records
How it works
Get to a useful
starting point.
A project can have thousands of tickets without a clear picture of what keeps coming up. BTA helps you look across that history and choose where to investigate.
- 1
Start with the repository
Connect GitHub or GitHub Enterprise. BTA collects issue and pull request descriptions, labels, dates, authors, status, and comment counts.
- 2
Look across the work
Group related items by their language. Examine them alongside timing, open work, and discussion volume to find areas worth a closer look.
- 3
Follow the examples
Open the source records, check what applies to your system, and bring specific examples to the people who know the work.
From the Kubernetes analysis
Find the details behind a platform change.
An API description can reveal prerequisites. A separate test report can give you specific failure conditions to investigate.
Published sources3 observations
What to investigate3 observations
An initial API implementation
Check what your intended release includes before planning adoption.
Open #139596A prerequisite feature gate
Follow the linked prerequisite and enhancement proposal.
Open #139596A separate version-skew failure
Compare the tested transition and checkpoint behavior with your environment.
Open #139069Three observations from two Kubernetes records: API scope and its prerequisite, plus a separate test failure. Source descriptions reviewed September 19, 2026.
Start with the findings. Open the sources when you want the detail.
BTA / PUBLIC ANALYSIS EXCERPTNext.js / Application upgrade08 SEP 2026
Know what to test
before you upgrade Next.js.
3,114 work items131 release recordsJun – Aug 2026
What we foundWhat to investigateSource
Image rendering in productionA crash reported in SSR but not development.
Test image rendering with your production build and configuration.
Source 01Routes failing after an upgradeIntermittent 404s despite a successful build.
Check in-app navigation, direct URLs, and refreshes on important routes.
Source 02Routine compatibility work111 React-sync and React 18 test PRs.
Separate maintenance activity from reported application behavior.
Source 03 Check against your system
Compare the reported versions, configuration, and hosting with your application.
Put it to use
Turn relevant reports into checks for your production build and important user journeys.
A short route into the findings and the records behind them.Explore the different views
When you need to understand the work quickly.
- Getting to know an unfamiliar system
- Investigating a recurring problem
- Preparing for a migration or upgrade
- Scoping a platform change
Look at the work from more than one angle.
A common topic may be routine maintenance. A long-running issue may be deliberately left open. Looking at language, timing, and discussion together helps you decide which records deserve attention.
What keeps coming up?
Find related subjects in issue descriptions, including work that isn’t grouped under the same label.
What stays unresolved?
Examine open items and work that has taken unusually long compared with the rest of the repository.
Where is the discussion?
Find items with unusually high comment counts, then read the threads to understand why.
What is changing?
Compare which subjects appear more often in different periods of the collected history.
Get specific about “this keeps slowing us down.”
That description is a starting point. The useful details may be spread across tickets: what failed, what people tried, and what remains open.
BTA helps bring related records together so you can investigate the particular problem, compare it with what people remember, and decide where to look next.
See the examplesSee what looking across the work can reveal.
These published analyses examine 14,518 work items across Next.js and Kubernetes. Each includes findings and the sources behind them. They cover different periods and scopes; the totals are not performance comparisons.
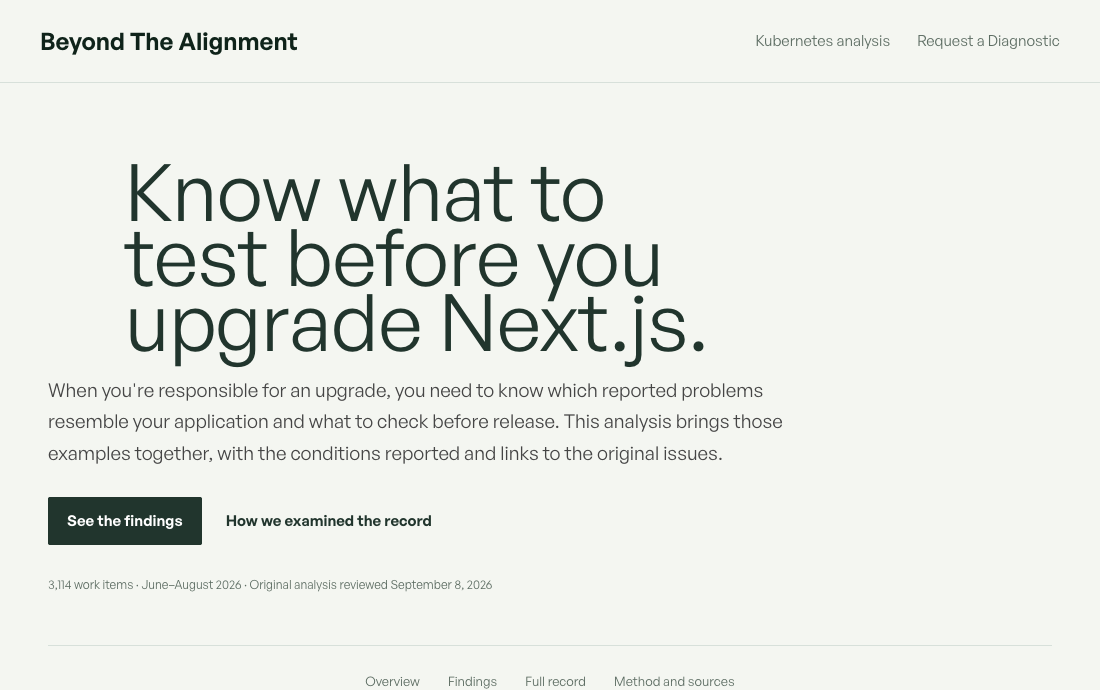
Next.js: know what to test before you upgrade
See how reported image-rendering and routing problems become specific checks for an application upgrade, with links to the original issues.
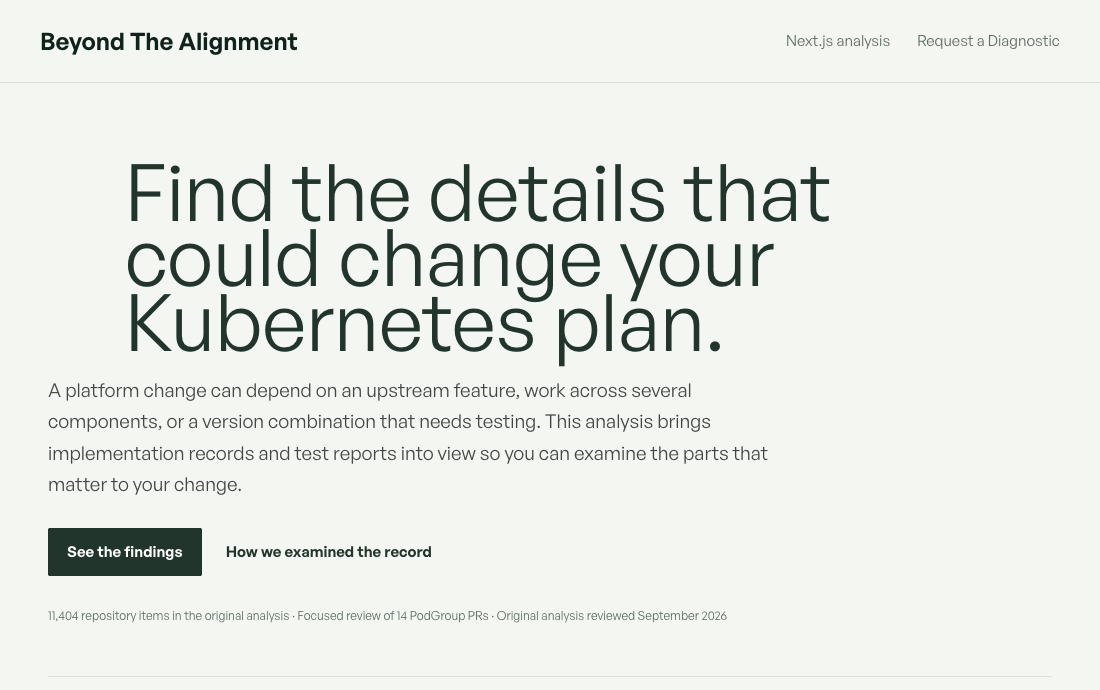
Kubernetes: find the details that could change your platform plan
Examine the scope of an upstream scheduling feature and a separate version-skew test failure. See how each can inform a platform investigation.
Run it in your environment.
BTA can run with Docker or Helm and connect to GitHub or GitHub Enterprise. Collected records and cached analysis stay in your environment.
Your environment
Your GitHubGitHub or Enterprise
BTA analysisDocker or Helm
Your storageLocal SQLite cache
Your configured model endpointFeatures that use a model can send selected material to the endpoint you configure.
Collection time depends on repository size and API limits. Later runs can reuse cached data.
A few practical questions.
What does BTA read?
The standard GitHub collection includes issue and pull request titles and descriptions, labels, authors, dates, open or closed state, and comment counts. The public analyses also cite additional material described in their source notes.
How does it find related work?
BTA groups records using their text, which can bring together items with different labels or no labels. Timing and discussion counts provide other ways to examine those groups. You can inspect the examples to check whether they belong together.
Why not just use GitHub or Jira?
You can learn a lot from the tools you already use. The harder part is knowing what to look for when you’re unfamiliar with the work, or when related problems have different labels. BTA brings several views of the repository history together so you can find related work, compare timing and discussion, and follow the examples worth investigating.
Couldn’t we do this with AI?
Yes. AI can help you investigate project history, and BTA uses models for some of its analysis. You still need to choose the records, organize them, decide what to compare, and check the results. BTA gives that work a repeatable structure, with several views of the same history and source records you can inspect. The value is in helping you find where to look, including things you might not have thought to ask about.
Does a pattern mean something is wrong?
A common subject or a long-running issue can have several explanations. BTA helps you locate and inspect the records. The people working on the system can explain the context that isn’t captured there.
Do we need a migration or upgrade planned?
No. You can also use BTA to get familiar with a repository, investigate a recurring problem, or review an area before deciding what work to take on.
Where does the data go?
BTA runs in your environment and keeps a local cache. Features that use a model can send selected material to your configured endpoint.
What do you need to understand?
Bring a repository, a recurring problem, or a change you’re preparing for. We’ll start with what you need to learn and agree on the scope of the diagnostic.
Read the public analysesRequest received.
Thanks. We will be in touch within one business day.